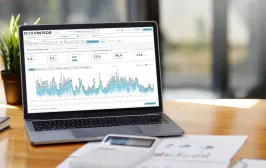
Technical features
Real-time - data refreshes automatically at configurable intervals (30 seconds to 5 minutes)
Multi-site - manage and monitor unlimited locations from a single dashboard
Role-based access - admin and viewer roles with per-user village assignments
Performance - intelligent downsampling for large time ranges, bulk database queries, PHP-side nearest-neighbor joins
Configurable - each user defines their own chart selection; only relevant data is displayed
Calculated KPIs - TSR, Cp and rotor RPM are derived from DC voltage measurements without additional sensors
No app install - pure browser-based, PWA-capable, works on desktop and mobile
Self-hosted - runs on your own infrastructure, full data sovereignty

Economic benefits
Reduce operational costs
remote monitoring eliminates the need for on-site inspections; issues are detected before they become failures
Maximize yield
real-time performance data and KPI tracking (TSR, Cp, power curve) identify underperformance immediately, enabling faster corrective action
One platform, all assets
wind, solar, battery, weather and generator data in a single dashboard reduces tool complexity and training overhead
Scalable
from a single installation to a network of sites, data.mine grows with your portfolio without additional licensing costs
Data ownership
self-hosted architecture means your operational data stays on your infrastructure, no third-party cloud dependency
Fast onboarding
browser-based, no client software required; new users are operational within minutes
Audit-ready
full historical data with configurable time ranges supports reporting, insurance documentation and performance guarantees
Competitive differentiation
offering clients real-time transparency into their energy systems builds trust and strengthens long-term relationships
Typical Use Cases
1. Remote site operator
A novventos nacaboost installation runs at a rural location without permanent staff. The site operator monitors wind performance, battery state and generator fuel level daily from the office - without travel. Anomalies trigger immediate review; the power curve chart shows whether the turbine is performing within expected parameters for the given wind conditions.
2. Energy consultant / EPC contractor
A project developer manages multiple client installations across different locations. data.mine provides a unified overview of all sites, with per-client user accounts and village assignments. Monthly performance reports are generated directly from historical chart data. TSR and Cp trends inform maintenance scheduling and turbine optimization recommendations.

3. R&D / Product development
The novventos engineering team uses data.mine to analyze turbine behavior across real-world installations. Wind vs. power scatter charts and TSR·Cp curves reveal how design parameters translate into field performance - without additional measurement hardware, purely derived from DC voltage and weather station data.

Do you have any questions?
Contact us – together, we'll find the optimal solution for your requirements!